Robinsons Retail had a stellar year in 2022.
We delivered an all-time high net sales of Php178.8 billion, 16.6% higher year-on- year and above pre-pandemic levels. While we saw strong topline contributions across the portfolio, the fastest growth rates came from our Department Store, Convenience Store, and Specialty segments. Meanwhile, our Supermarket and Drugstore segments continued to generate healthy topline growth aided by higher transaction count and contributions from newly opened stores.
Robinsons Retail opened a total of 174 stores in 2022, with the bulk coming from the Supermarket and Drugstore segments. We also closed down a number of stores that have underperformed relative to our initial expectations. We ended the year with 2,310 stores, comprising 324 supermarkets, 993 drugstores, 223 DIY stores, 51 department stores, 424 convenience stores, and 295 specialty stores. As of year-end, our Specialty segment was composed of 120 appliances & electronics stores, 113 mass merchandise stores, 41 toy stores, 12 beauty stores, and 9 pet stores. In addition to our 2,310 strong store portfolio, we also ended the year with 2,151 franchised stores of TGP.
Our blended same-store sales growth (SSSG) of 11.8% in 2022 is a level that we have not seen since we went public in 2013. Our Convenience Store segment alongside our discretionary segments - Department Store, DIY, and Specialty in particular - all delivered double-digit SSSG in 2022. Meanwhile, our core staples businesses - Supermarkets and Drugstores - generated mid to high single digit SSSG for the year.
Our gross profit margin expanded by 70 basis points in 2022 to 23.6% driven by changes in category mix and economies of scale. This enabled us to grow our gross profit faster than sales, rising by 20.0% for the full-year to Php42.3 billion. Margin gains at the gross profit level augmented by better operating leverage and deliberate cost controls translated to 30 basis points and 90 basis points expansion in our EBITDA margin and EBIT margin, respectively, to 8.9% and 4.9%. As a result, both our EBITDA and operating income also accelerated relative to the topline, increasing by 20.8% and 43.6%, respectively, to Php15.9 billion and Php8.7 billion in 2022.
Robinsons Retail’s net income attributable to equity holders of the parent company reached a record Php5.8 billion in 2022, 29.1% higher year-on-year and also significantly above pre-pandemic levels. Our earnings per share (EPS) rose at a faster clip, growing by 33.1% to Php3.93, aided by the ongoing stock buyback program. Meanwhile, our full-year core net earnings (net income excluding FX, interest income from bonds, equitized earnings from Robinsons Bank, and others) accelerated by 46.1% to Php5.6 billion, another record high.
Contributing to Shared Growth:
Direct Economic Value Generated and Distributed
| in million pesos | 2020 | 2021 | 2022 |
|---|---|---|---|
| Direct economic value generated (revenue) | 151,070 | 155,013.2 | 180,677.8 |
| Direct economic value distributed: | |||
| a. Operating costs | 20,366 | 139,283.0 | 161,867.9 |
| b. Employee wages and benefits | 9,165 | 9,802.3 | 10,154.7 |
| c. Payments to
suppliers, other operating costs |
121,303 | already included
in operating cost |
already included
in operating cost |
| d. Dividends that are given to stockholders | 2,067 | 3,306.0 | 3,662.6 |
| e. Taxes given to
the government Investments to the community (e.g., donations, CSR) |
1,767 | 1,743.7 | 2,291.3 |
| f. Investments to
the community (e.g., donations, CSR) |
17.2 | 37.6 | 13.1 |
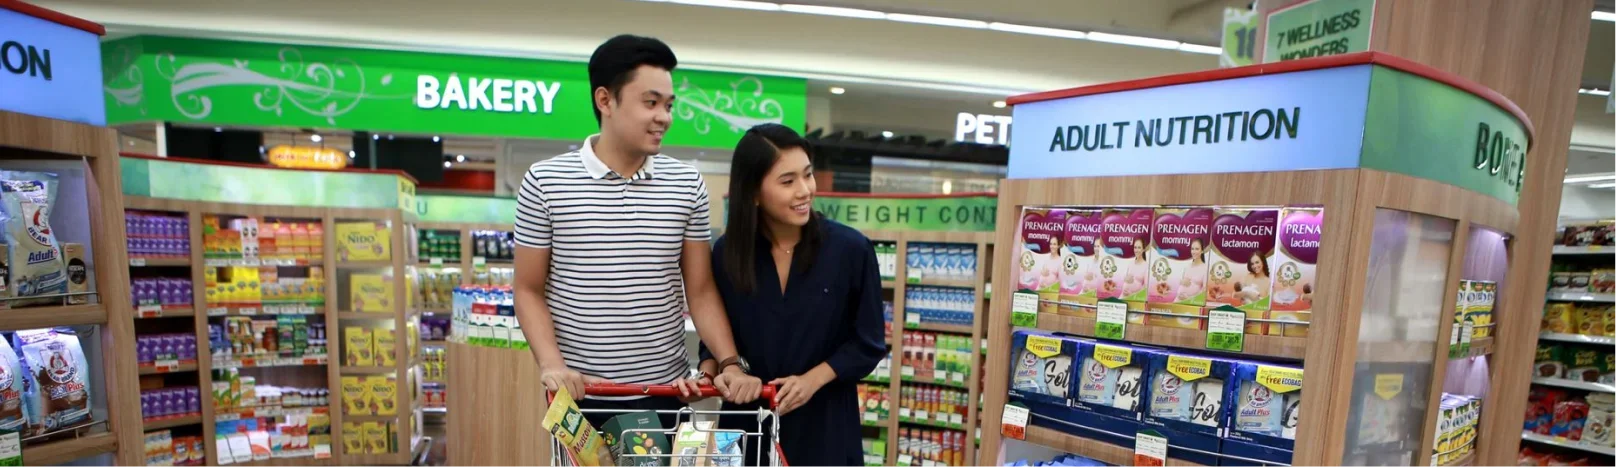
At Robinsons Retail, we aim to create shared value and foster shared successes. Our operations and supply chain allow us to, directly and indirectly, impact the economic conditions of areas where we operate by generating employment and nurturing an extensive network of partners and suppliers from across various entrepreneurial backgrounds. This year, the economic value we retained was at Php 2.7 billion.
In our efforts to maintain our strong financial foundations to continue operations and remain resilient, we continue to develop business continuity plans to protect our assets and have a dedicated Enterprise Risk Management Team overseen by the Board of Directors.
We continue to implement our Share Buy Back Program worth Php 6.0 billion to increase shareholder value. Our annual cash dividend payout ratio in 2022 is at 68%, compared to last year’s 89%, well above the board-approved pay-out ratio of 40%.
As we continue to do business, we hope to be able to sustain store expansion in underserved areas, maintain a strong online presence, execute value-accretive acquisitions, identify key areas for efficiency within the business, and continue embedding sustainability. We also look towards data-driven decision-making, supply chain and operation efficiency, and collaborative initiatives with partners for sustainability.
.webp)
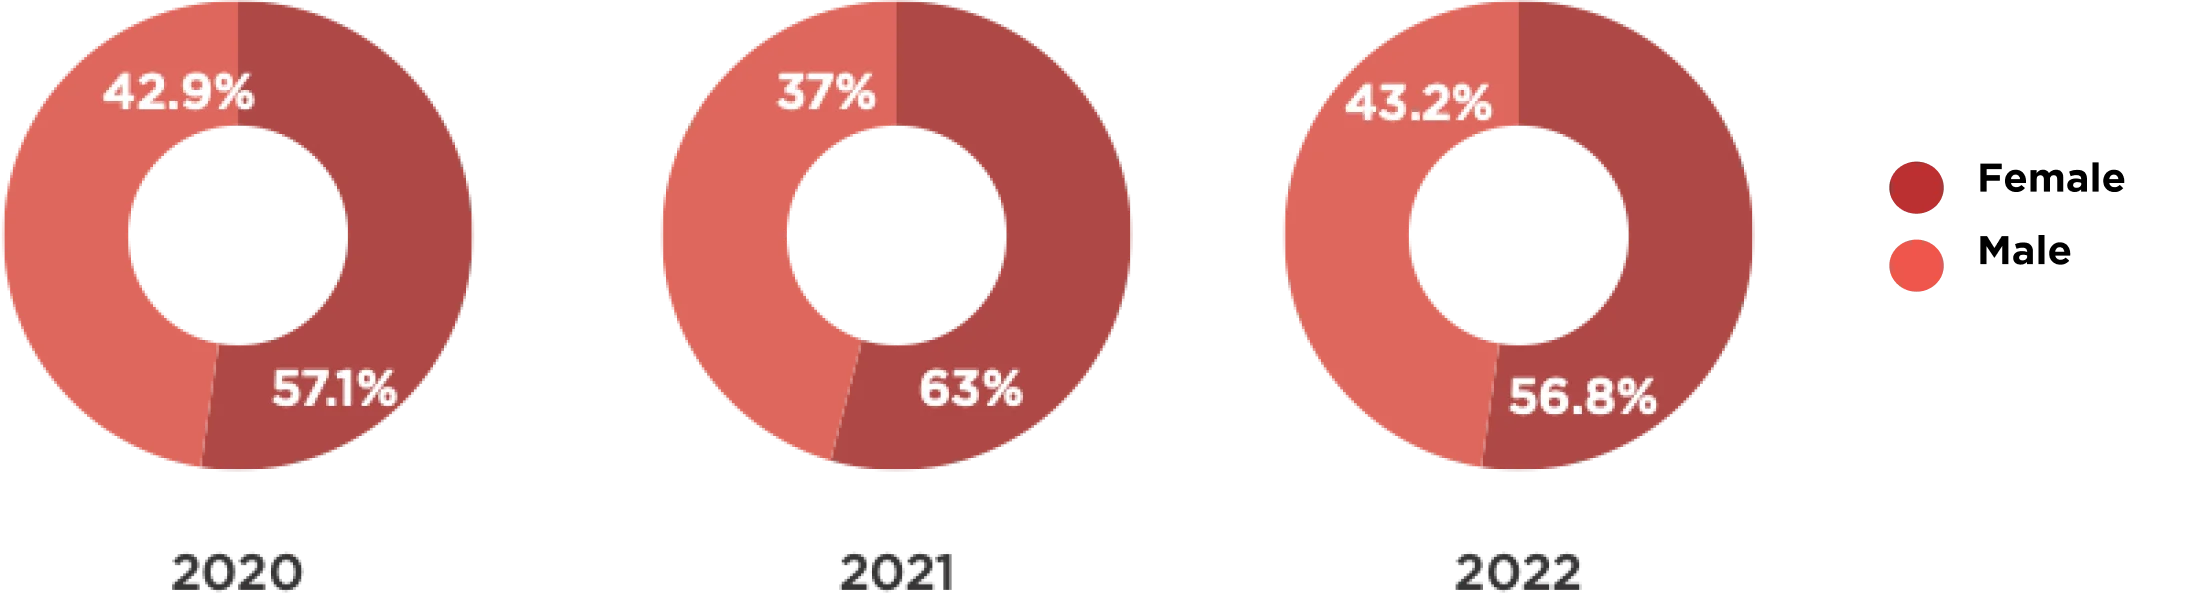
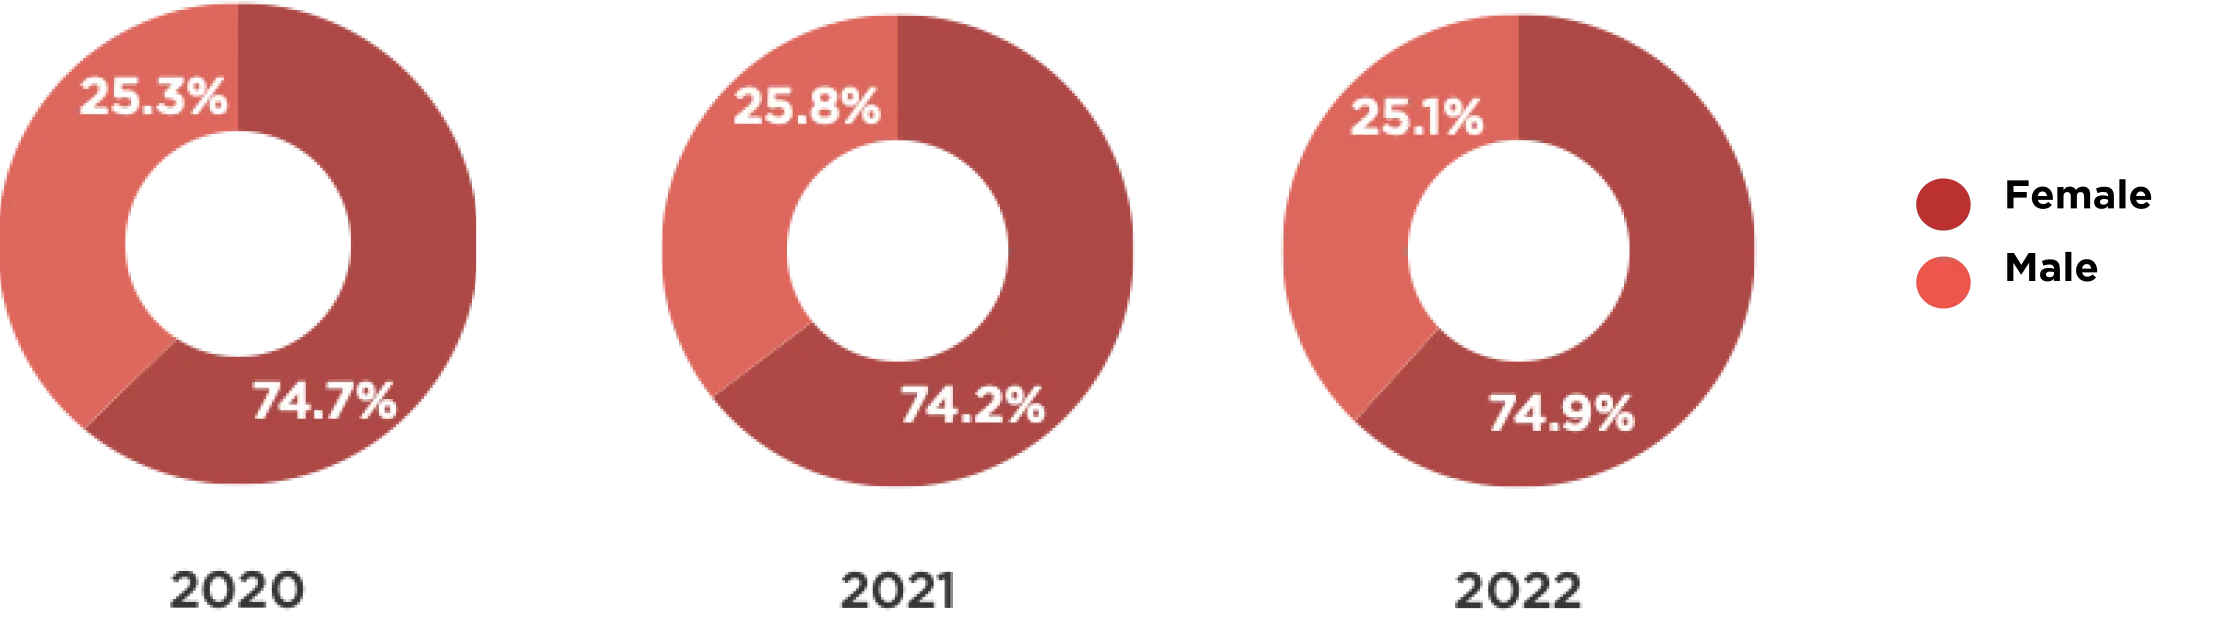
Driving Innovation through Diversity
All of our employees bring unique skills, perspectives, and experiences to the work we do at Robinsons Retail. This diversity bolsters our dynamic and innovative approach to business and is a testament to the importance of valuing every individual.
We continue to strive for inclusive workplaces that promote equality and fairness through an objective, non-gendered approach to hiring employees and onboarding. This allows us to tap into and retain a wider range of talent, skills, and perspectives leading to increased productivity and innovation as we contribute to a more equitable and sustainable future.
At present, 71% of our workforce is women across all levels of management, including our President and CEO, our Chief Financial and Chief Risk Officer, our Corporate Secretary, and our Head of Corporate Planning, Investor Relations and Sustainability as well as seven out of 15 Business Unit Heads.
Our efforts in championing our employees resulted in our re-inclusion in Bloomberg’s Gender Equality Index as well as in the Philippine Daily Inquirer and Statista’s list of the Philippines’ Best Employers, together with our subsidiary Robinson’s Supermarket Corporation.

| 2020 | 2021 | 2022 | |
|---|---|---|---|
| Total number of employees¹ | 18,555 | 20,535 | 21,495 |
| Number of female employees | 13,149 | 14,629 | 15,281 |
| Number of male employees | 5,406 | 5,906 | 6,214 |
| Voluntary Attrition rate | 14% | 9% | 19% |
¹Vulnerable sectors include, the elderly, persons with disabilities, vulnerable women, refugees, migrants, internally displaced persons, people living with HIV and other diseases, solo parents, and the poor or the base of the pyramid (BOP; Class D and E). The count of employees declared are the PWDs from Southstar Drug (SSD)
Diversity and Equal Opportunity (in Percentage)
Workers in the Workforce

Workers in Executive Level Positions
Workers in Managerial & Supervisory Roles

Workers in Rank & File Positions
Employees from Indigenous Communities and/or Vulnerable Sectors¹

¹Vulnerable sectors include, the elderly, persons with disabilities, vulnerable women, refugees, migrants, internally displaced persons, people living with HIV and other diseases, solo parents, and the poor or the base of the pyramid (BOP; Class D and E). The count of employees declared are the PWDs from Southstar Drug (SSD)
Inclusive Talent Strategy
We believe that adequate compensation and above-average benefits are effective strategies for talent acquisition and retention. We benchmark our rates against industry standards and ensure that it is aligned with the 25th percentile in the general industry salary structure.
We also provide benefits beyond what is mandated by the government. These include transport services, allowance packages, loans, and other forms of assistance and incentives.
We continue to explore ways to grow and retain talent by understanding the culture and priorities of Millennial and Generation Z employees with open lines of communication between employees and their immediate supervisors, as well as creating an inclusive and flexible work environment that allows employees to create their work routines and methods for productivity.
| Rate of employees utilizing benefits in 2022 | ||
|---|---|---|
| Employee Benefits | Female | Male |
| SSS | 100% | 100% |
| PhilHealth | 100% | 100% |
| Pag-ibig | 100% | 100% |
| Parental leaves | 0.42% | 0.53% |
| Vacation leaves | 51% | 45% |
| Sick leaves | 25% | 18% |
| Medical benefits | 21% | 15% |
A
Safe and Happy Workplace
Occupational health and safety is relevant to us because it impacts the welfare of our employees and their capacity to work. We abide by safety, health, and welfare standards and policies set by the Department of Labor and Employment to
provide safe and healthy working conditions for employees, customers and other stakeholders who visit our premises, patronize our establishments, shop or dine at our stores, or may be affected by our activities.
We also have Security and Safety Manuals that are regularly reviewed to ensure its continued effectiveness and relevance. We have a Corporate Emergency Response Team (CERT) tasked with spearheading initiatives across the conglomerate during a crisis. The CERT shall also be responsible for the periodic review of contingency plans and our emergency preparedness and response procedures to ensure that effective responses and responsible policies are in place to deal with crisis or emergency situations.
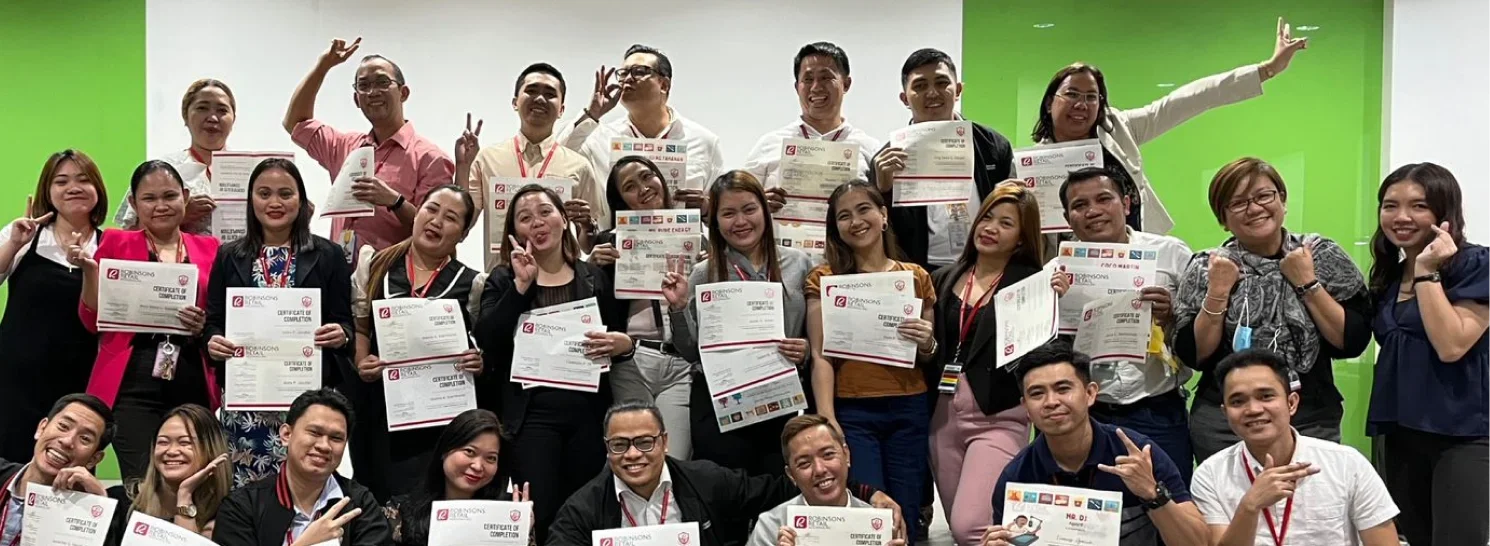
Robinsons Retail Academy
The Robinsons Retail Academy (RRA) is the branded academy designed by our Learning & Organizational Development (L&OD) team to provide learning opportunities to employees.
It is a structured approach to employee development that aims to enhance skills, knowledge, and expertise within the organization. The academy typically provides a range of training courses, workshops, and seminars that are relevant to our business objectives and the professional development of our employees.
RRA provides a centralized approach to employee development. Instead of searching for training opportunities on their own, the academy provides a single point of contact for all training needs. This ensures that employees receive consistent and relevant training that aligns with our objectives and values.
Robinsons Retail Academy
NEO
New Employee Orientation
An Employee orientation program
for new RRHI employees.
for new RRHI employees.
DLP
Digital Learning Program
A set of bi-weekly curated programs focusing on essential skills.
knowledge and mindset: the courses focus on Personal Excellence. People Excellence and
Operational Excellence
REC
Retail Excellence Curriculum
A set of learning roadmaps per level for all employees focusing on
building retail-based leadership and managment competencies.
MDC
Management Development Curriculum
A set of learning roadmaps for key talents focusing on developing them
for their current and future roles aligned to both functional and leadership management
competencies.
TP
Thematic Programs
A pool capability building programs supporting the
organization’s goals and strategies. (e.g Supply Chain, Customer Experience)
Target Participants
I. Frontline Leaders
Levels 1 - 3
Operations: e.g. Cashier, Sales
Clerk
Support Group: e.g. Assistants
Support Group: e.g. Assistants
II. Supervisory Leaders
Levels 4 - 5
Operations: e.g. SSO, SSA, DH
Support Group: e.g. Officers
Support Group: e.g. Officers
III. First-Line Leaders
Levels 6 - 7
Operations: e.g. Store Managers
Support Group: e.g. Managers
Support Group: e.g. Managers
IV. Strategic Leaders
Levels 8 - 9
Operations: e.g. OMs, ROMs/GOMs
Support Group: e.g. Senior Manager
Support Group: e.g. Senior Manager
RRHI Core Competencies
| Supply Chain | Retail Operations | Customer Experience | Finance | Leadership |
|
Personal Excellence
(Leading Self) People Excellence
(Leading Teams) Operational Excellence
(Leading The Business) |
||||
|
Leadership Competencies |
||||
|
RRHI Values |
||||
RRA allows us to accelerate our efforts in employee development and improve our overall productivity and efficiency. We conduct a Training Needs Assessment annually, which guides the designing and development of new learning and development opportunities.

Strengthening Partnerships for Shared Value
Our suppliers and trade partners are integral to our creation of shared value as well as supporting the livelihood of various businesses and providing access to goods for our end-consumers. Currently, over 90% of our vendors are Philippine-based manufacturers and distributors, including those that source products abroad and serve as the official distributors of foreign brands.
To reinforce our commitment to nurturing better relationships with these essential partners, we continue to work towards improving forecasting demand to maintain just-in-time inventory deliveries to increase supply efficiency allowing us to reduce shrinkage or wastage. Through the cross-docking systems at our distribution centers, we are also able to speed up the delivery of products and reduce the unnecessary maintenance of stocks.


A Sustainable
Supplier Accreditation Policy
We piloted a supplier sustainability survey among our Supermarket segment’s top vendors in 2021 composed of major global and local fast-moving consumer goods (FMCG) manufacturers, contributing to over 50% of the total sales of the segment. These vendors were surveyed on five key ESG topics: (1) environment/waste policy, (2) energy consumption/reduction plans and targets, (3) landfilled waste reduction plans and targets, (4) child rights and labor policy, and (5) sustainability reporting. This pilot run provided valuable insights in relation to the level of uptake of these top vendors towards sustainability.
Given the insights we gained from the pilot, we have taken steps to be more deliberate in engaging our suppliers to adopt sustainability practices and performance monitoring. In 2023, we will be starting to integrate crucial ESG metrics into our Supplier Accreditation Policy and the accreditation process for our top 30 vendors in the Supermarket and Drugstore segments. These two segments were chosen for the first run due to their scale of impact, as they compose almost 75% of our total sales in Robinsons Retail.
This year, we began conducting consultation meetings with the merchandising teams of the respective participating segments and their top vendors. Our ESG integration aim is to offer a harmonized approach that will be simple for suppliers to understand and gather the necessary data while not compromising the overall quality of the metrics. We look forward to expanding this initiative to other suppliers in other segments in the coming years.
Energy and Greenhouse Gas (GHG) Management
As we rely on electricity and fuel for our overall store and office operations, we continue to take active steps towards actively reducing our carbon footprint while expanding our store network.
This year, we expanded our electricity consumption data scope to include consumption data from Uncle John’s non-franchised stores, which was made possible due to continuing improvements in our data-gathering practices. Our Supermarket segment stores still constitute most of our electricity consumption, representing 67% of total consumption, which excludes consumption from our franchised stores in Uncle John’s and TGP.
We have started the data gathering exercise for some of our franchised stores in Uncle John’s and will be expanding this further to our TGP franchise stores in line with mapping our indirect GHG emissions across our business value chain (Scope 3 GHG emissions).
Our energy reduction initiatives remain across all our stores, such as the conversion of our old air conditioning units to inverter types, the conversion of old light bulbs to LED, and close monitoring and preventive maintenance of energy-intensive store equipment.
While we use diesel and gasoline fuel to run our company-owned vehicles, delivery trucks, and generator sets, emissions from our total fuel consumption only constitute around 1% of our total direct GHG emissions (Scope 1).
The bulk of our direct GHG emissions impact comes from our refrigerant consumption. We started to collect refrigerant consumption data used for the refrigeration and cooling systems of the Supermarket segment in 2021, alongside a proactive approach to reducing consumption. We have been continuously converting our old refrigerants to ones with a lower carbon footprint and are expanding the use of water-loop refrigeration systems, which were first launched in Robinsons Supermarket Capitol Hills, Quezon City. We implemented the same water-loop refrigeration system in 2022 at our new The Marketplace store in Banawa, Cebu City. With all these efforts, we reduced our GHG emissions from refrigerants to 20% compared to 2021, despite our continuous store expansion.
We remain committed to the climate action targets we made public in 2021. However, we will be finetuning them in the next one to two years as we finalize our net-zero targets. We will also be mapping our Scope 3 GHG emissions starting in 2023.
| Energy and Fuel Consumption | 2020 | 2021 | 2022 |
|---|---|---|---|
| Energy consumption - electricity (in kWh)* | 239,769,175.6 | 286,508,318.6 | 355,823,688.9 |
| Fuel Consumption (in liters) | |||
| Gasoline - company-owned vehicles | 161,340.6 | 178,413.8 | 173,120.2 |
| Diesel - company-owned vehicles | 156,253.2 | 164,943.9 | 194,136.1 |
| Diesel - company generator sets | Data not gathered | 339,412.6 | 251,655.3 |
*Energy consumption for 2022 now includes electricity consumption from the stores of Uncle John’s.
GHG Emissions
(in metric
tons of CO2 equivalent or MtCO2e)
Scope 1 GHG Emissions - Direct*
Scope 2 GHG Emissions - Electricity **

*Scope 1 GHG emissions data for 2021 and 2022 include emissions from fuels used for company generator sets and from refrigerant consumption, while 2020 data only includes emissions from fuels used for company-owned vehicles.
**Scope 2 GHG emissions for 2022 include emissions from the energy consumption of Uncle John’s.
.webp)
Materials and
Solid Waste
Management
We use renewable and non-renewable materials like paper and plastic for consumer packaging and make sure to constantly monitor the consumption of these materials and work towards reducing our consumption.
Across all our stores, we have increased the use of paper and eco-bags. At Uncle John’s, we have been actively encouraging more dine-in transactions and converting ready-to-eat packaging made of lightweight yet durable packaging to reduce plastic and paper use.
In the coming years, we will be expanding our disclosure of renewable and non-renewable materials with necessary reduction targets.
| Renewable and Non-Renewable Materials Consumption (in metric tons) | 2020 | 2021 | 2022 |
|---|---|---|---|
| Renewable | 2,222 | 2,595.3* | 3,316.3 |
| Non-renewable | 891 | 1,730.6* | 2,298.0 |
*2021 data restated due to review and improvements in data gathering practices.
We are also cognizant of the waste we generate as a business. We continue to implement waste segregation measures throughout our stores and distribution centers and target to systematize our solid waste generation data across all banners. This detailed data-gathering system will help us guide our waste recycling and diversion targets.
Currently, we are building monitoring systems for our supermarkets with diverse waste profiles. In coordination with our vendors, we also strictly comply with the requirements on the proper disposal of identified “bad” or expired products and ensure that sub-par items do not reach the market.
| Solid Waste Generation (in kg) | 2020 | 2021 | 2022 |
|---|---|---|---|
| Total solid waste generated | 10,293,112.9 | 14,237,742.0 | 10,169,308.1 |
| Recyclable | 1,853,688.5 | 5,882,013.0 | 4,252,467.5 |
| Biodegradable/Food Waste | 7,160,961.3 | 7,902,928.0 | 5,317,623.1 |
| Residuals | 1,278,463.1 | 452,801.0 | 599,217.46 |
| Solid Waste Diversion (in kg) | 2021 | 2022 |
|---|---|---|
| Recycled Waste | 1,895,356 | 1,863,074.7 |
Water
Management
Although our businesses do not require as much water as others, we remain vigilant in monitoring our water use, which we source from local third-party lines.
Our water consumption is primarily due to office and store lavatory use as well as regular maintenance and cleanup. We regularly monitor our plumbing and water systems to prevent major losses due to leakages and other wastage.
Water consumption (in cubic meters)

Commitment to Consumer Protection
Ensuring the overall welfare of our customers is an essential aspect of our commitment to excellence. We strictly implement quality control and assurance measures, primarily through our Consumer Protection Manual, pursuant to BSP Circular No. 857: Regulations on Financial Consumer Protection, which we regularly review and update as needed.
We also ensure that our customers can reach us easily via a range of communication channels for feedback, including but not limited to customer service kiosks at our stores, online inquiry forms on our corporate and banner websites, and our social media channels.
In 2022, the Supermarket segment improved its complaints resolution rate to 85.4%, compared to 84.3% in 2021. The segment is working to continuously improve through its elevated customer service. In the coming years, we will be conducting more customer satisfaction surveys across all our business units and continuously improve complaint resolution rates.